The Essential Guide to Azure Monitor 

Without proper monitoring, you invite chaos into your cloud. 

You can start the day with everything running smoothly, and by lunchtime you’re troubleshooting a failed app, or investigating a security breach. 

Azure Monitor alerts can be your early warning system. They’re your secret weapon for spotting potential problems with your cloud infrastructure—including any financial black holes. 

This guide will walk you through how to use Azure Monitor as a powerful tool for visibility, security, performance management, and even cost optimisation. 

So what does Azure Monitor actually do? 

Azure Monitor is Microsoft’s platform for collecting, analysing, and acting on telemetry from your Azure environments. It’s the nervous system of your Azure infrastructure—constantly sensing what’s happening and ready to alert you when something needs attention. 

Its general functions are: 

  • Warning you of potential problems in your infrastructure and apps 
  • Flagging security issues like breaches or suspicious activity 
  • Optimising resource usage so components aren’t under-used or maxed out 
  • Helping improve performance by identifying relevant telemetry data 
  • Tracking costs and usage patterns to help budget overruns 

Essentially, Monitor collects, processes and helps you understand data from across your entire environment. 

The complete Azure Monitor ecosystem

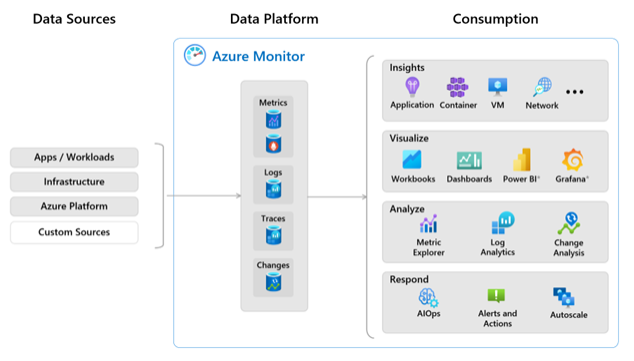
Azure Monitor isn’t a standalone product, but actually a collection of integrated monitoring services that work together. Each component has a specific purpose, which we’ll go through below. 

Azure Monitor’s end-to-end pipeline starts with gathering data. Then, it organises it efficiently and then gives you useful ways to work with that information. 

Data sources 

These are where Azure Monitor collects information. Together, they bring you different perspectives on what’s happening in your cloud environment: 

  • Apps/workloads: This is where you get visibility into what your users are actually experiencing. Are your web pages loading quickly? Are API calls completing successfully? Are exceptions happening in your code? This source captures telemetry directly from your application code and user interactions, giving you insight into the front-line experience. 
  • Infrastructure: These are the engines powering your apps. Your virtual machines, containers, databases, storage accounts, and network components all generate valuable monitoring data. This helps you understand if you have enough horsepower, storage space, and bandwidth to keep everything running smoothly. 
  • Azure platform: This is information about Azure itself and how your subscription is being used. It captures events like who’s making changes to your resources, when maintenance is happening, or if there are issues with Azure services that might affect you. 
  • Custom sources: Not everything lives in Azure. This source brings in data from your on-premises systems, other cloud providers, or specialised services that might not otherwise integrate with Azure Monitor. It’s your way of getting a complete picture even in hybrid or multi-cloud scenarios. 

Data types 

Once collected, data is organised into four main types. Each type serves a different monitoring purpose: 

  • Metrics: These are the vital signs of your systems—numerical values like CPU percentage, available memory, or request counts that are collected at regular intervals. When you want to know “how much” or “how many” right now, metrics are what matter. 
  • Logs: When you need to understand what happened and why, logs are your detailed record. They contain rich information like error messages, activity records, and diagnostic data that help with troubleshooting and deep analysis. While not as immediate as metrics, logs provide the context and detail that metrics alone can’t offer. 
  • Traces: These are breadcrumb trails showing the journey of a single operation through your distributed systems. If you want to understand why a particular user request took 10 seconds to process, traces show you each step it went through and how long each component took. They’re super useful for understanding performance bottlenecks and dependencies in complex applications. 
  • Changes: These track what’s different in your environment. When something stops working, one of the first questions is always “what changed?” This data helps you answer that question by recording modifications to your infrastructure, configurations, and deployments. It’s your historical record of how your environment has evolved. 

How the data is used 

This is where all that information becomes useful. Here are the ways Azure Monitor uses all this collected data to improve your operations: 

Insights: Out-of-the-box monitoring solutions for specific resource types that require minimal setup.  

Visualise: Tools that turn complex data into understandable visuals.  

  • Workbooks let you create interactive reports combining text, queries and charts.  
  • Dashboards give you at-a-glance status of key metrics.  
  • Power BI gives you access to advanced data analysis.  
  • Grafana offers advanced visualisation for operational teams. 

Analyse: Capabilities for investigating issues and identifying trends.  

  • Metrics Explorer lets you interactively explore and chart your metrics data.  
  • Log Analytics provides a powerful query language for searching and analysing logs.  
  • Change Analysis helps pinpoint what modifications might have caused problems.

Respond: Features that take action based on monitoring data. These capabilities transform monitoring from passive observation into active management of your environment. 

  • AIOps uses machine learning to identify patterns and reduce noise.  
  • Alerts and Actions notify you of issues and can trigger workflows to address them.  
  • Autoscale automatically adjusts your resource capacity based on demand.  

The reason Azure Monitor is so powerful is that all these components work together to give you maximum visibility.  

So, you might receive a metric alert about high CPU usage, then use Log Analytics to find detailed error messages explaining why, and check Activity Log to see if someone made a configuration change that triggered the issue – all within the same monitoring framework. 

Now let’s take a look at some practical uses of these handy tools.  

Four key ways Azure Monitor can transform your cloud operations 

Azure Monitor isn’t just a cost-tracking tool—it’s a complete monitoring solution that can revolutionise how you manage your cloud environment. Here are four critical capabilities that make it invaluable: 

1) Gaining total visibility across your environment 

One of the biggest challenges with cloud environments is maintaining visibility across increasingly complex systems. Azure Monitor gives you that unified view, bringing together data from infrastructure, apps, and services. 

This end-to-end visibility means you can: 

  • Track dependencies between components to understand how they affect each other 
  • Identify the root cause of issues faster by seeing the complete picture 
  • Monitor hybrid environments that span on-premises and multiple clouds 
  • Create custom dashboards that show exactly what matters to different teams 

For many organisations, this holistic view alone justifies the investment in proper monitoring. It saves you from a lot of manual data scraping and analysis.  

2) Keeping your Azure resources secure 

Security monitoring is, unsurprisingly, a major function of Azure Monitor. It helps identify potential threats and vulnerabilities by: 

  • Detecting unusual access patterns or potentially malicious activities 
  • Spotting configuration changes that might introduce security risks 
  • Integrating with Defender for Cloud for security posture management 
  • Alerting on compliance drift or policy violations 
  • Providing audit trails for regulatory compliance 

Really, the main benefit of proper security monitoring is that you can respond to threats before they become breaches. 

Keeping that strong security posture across your entire Azure estate is made much simpler with Monitor keeping a watchful eye over things. 

3) Optimising performance for applications and infrastructure 

Poor performance costs money—both directly (through inefficient resource usage) and indirectly (through lost productivity and customer dissatisfaction). Azure Monitor helps you optimise performance by: 

  • Identifying bottlenecks in your apps and infrastructure 
  • Monitoring end-user experience through real user metrics 
  • Tracking performance indicators like page load times or API response times 
  • Setting up proactive alerts for performance degradation 
  • Using AI-powered insights to detect anomalies before users notice problems 

These capabilities help ensure your applications are always performing at their best, keeping both users and stakeholders happy. 

4) Controlling costs before they spiral 

While Azure Monitor does much more than just track costs, it’s still a really good tool for cost optimisation. As it provides real-time insights into resource usage and spending patterns, it helps you: 

  • Identify underutilised resources that you’re paying for but not fully using 
  • Detect unusual spending patterns before they impact your bottom line 
  • Right-size your resources based on actual usage rather than guesswork 
  • Automate scaling to match demand and avoid overpaying during quiet periods 
  • Create accountability by allocating costs to specific teams or projects 

If you combine Azure Monitor with Azure Cost Management, you get both proactive and retrospective control over your cloud spending. That should make your CFO happy.   

As you can see, there’s absolutely loads of data available, and a huge amount of ways you can use it to tinker with things. Let’s move from theory to practice, and get started with some easy monitor wins.  

Five types of alerts you should know about 

Azure Monitor offers several types of alerts, each designed for specific monitoring scenarios. Understanding which to use and when is key to effective monitoring: 

1) Metric alerts for real-time monitoring 

These are your first line of defence – quick, responsive, and straightforward. Metric alerts watch numerical values and trigger when they cross thresholds you define. 

Picture this: It’s 3 AM and your e-commerce site’s response time suddenly spikes to 5 seconds. A metric alert can notify your on-call engineer within minutes, potentially before customers start abandoning their shopping carts. That’s the power of near real-time monitoring. 

Metric alerts excel at watching vital signs like CPU usage, available memory, or request rates. You can set them to trigger immediately or to confirm a problem exists for a certain duration before alerting (nobody wants to be woken up for a 5-second CPU spike that resolves itself). 

The beauty of metric alerts is their simplicity. You’re essentially saying, “Let me know when X exceeds Y for Z amount of time,” making them perfect for clear-cut monitoring scenarios. 

2) Log alerts for complex pattern detection 

Sometimes the issues you’re monitoring for aren’t as simple as a number crossing a threshold. That’s where log alerts come in. 

Imagine you need to know when specific error patterns appear across multiple systems, or when certain users perform sensitive actions. Or maybe when a combination of factors indicates a potential problem brewing. Log alerts let you write custom queries using Kusto Query Language (KQL) to look for these complex patterns. 

Consider this. A financial services company might create a log alert that triggers when: 

  • A user accesses customer financial data 
  • Outside of normal business hours 
  • From an IP address not previously associated with that user 
  • And then downloads an unusually large amount of data 

No single metric could catch this potential data theft scenario, but a well-crafted log query can tie these breadcrumbs together. 

There is a trade-off, though. 

Log alerts typically have a longer latency than metric alerts – usually 5-15 minutes rather than near-immediate. They’re also more complex to set up. But when you need a digital detective looking for dodgy patterns, nothing else will do. 

3) Activity log alerts for keeping tabs on admin changes 

Who deleted that production database? When did that security rule change? Why is one of our connections down? Activity log alerts help answer these questions by notifying you about important administrative actions or service health issues. 

These alerts are particularly valuable for: 

  • Security teams monitoring for unauthorised changes to critical resources  
  • Operations teams tracking successful and failed administrative actions  
  • Compliance officers ensuring policy adherence  
  • IT managers staying informed about Azure service issues 

These alerts help you maintain control over who’s making changes to your environment and stay informed about Azure problems that might affect you. 

4) Smart detection alerts that find problems for you 

What if you don’t know exactly what to monitor for? Try smart detection alerts – the AI-powered members of your monitoring team that can spot patterns you might miss. 

Using machine learning, these alerts establish baselines of normal behaviour and then ping you when something unusual happens. No thresholds to set, no queries to write – just automated anomaly detection. 

You can see smart detection alerts catch subtle issues that would’ve gone unnoticed with traditional monitoring, like: 

  • A gradual memory leak that would eventually crash a service 
  • Unusual failure patterns affecting only a subset of users 
  • Dependency failures affecting one region but not others 
  • Abnormal spikes in exception rates following a deployment 

Abilities like these pay off in complex, dynamic environments where setting static thresholds is impractical and where patterns might be too subtle for humans to notice immediately. It’s one of those areas where you’re probably okay with a machine taking over your job. 

5) Cost and budget alerts to protect your wallet 

Budget alerts are straightforward – they let you know when cloud spending approaches or exceeds your predefined budget thresholds. So, you can set alerts at 70%, 90%, and 100% of your monthly budget to avoid nasty surprises at month-end. 

Cost anomaly alerts are a bit more sophisticated – they use AI to learn your normal spending patterns and alert you when something unusual happens. So, if your data transfer costs suddenly spike on a Tuesday afternoon when they’re usually low, you’ll know about it. 

The upside of these alerts isn’t just that they protect your budget – they also create accountability and cost awareness across your organisation. When team members know their resource usage is being monitored, they can become more conscientious about cleaning up after themselves. 
Advanced alert configurations for smarter insights 

Some of these advanced configurations can be rather technical. But don’t let that put you off. We’re sharing these possibilities to show you what’s achievable when you really want to fine-tune your monitoring system. 

Dimensional metrics – for fine-tuning your alerts 

Standard metric alerts are powerful, but dimensional metrics take this to another level. Instead of just monitoring a single value, dimensional monitoring lets you split your metrics by specific properties and create targeted alerts for different scenarios. 

Your production SQL database might need rapid response to even a 5% increase in latency, while your development database can tolerate much higher thresholds. So, rather than creating separate alerts for each database, dimensional metrics let you set different conditions based on the “environment” dimension. 

There are many ways to make use of them: 

  • Setting different CPU thresholds for peak hours vs. overnight 
  • Monitoring memory usage separately for different application tiers 
  • Creating distinct response time alerts based on geographic regions 
  • Applying different disk space alerting for critical vs. non-critical storage 

With this, you’ve got a more nuanced alerting system that reduces noise while still catching important issues. It’s like having a security system that knows the difference between your cat moving around the house and an actual intruder. 

Dynamic thresholds for seasonal workloads 

Those dimensional metrics can be combined with dynamic thresholds for an even more useful type of monitoring. 

If your business has predictable busy periods or natural cycles, static thresholds won’t cut it. Dynamic thresholds adjust automatically based on historical patterns, giving you season-aware performance monitoring. This reduces false alarms during expected usage spikes.  

Dynamic thresholds also adjust to gradual changes in your baseline and detect truly abnormal behaviour. They usually need several weeks of historical data to identify patterns, but once in place, they dramatically reduce alert noise while improving detection accuracy. 

Cascading alert systems 

Think of these as alert escalations. Start with gentle nudges for minor issues, then progressively more urgent notifications as situations worsen. A small performance degradation might warrant an email, while a complete service outage could trigger a text message to the IT director. 

This gradual approach would make sure that the response matches the severity of the issue. It’d stop people ignoring alerts while ensuring critical problems get immediate attention. 

Integration with auto-scaling 

One of the ideal forms of monitoring is when your alerts don’t just notify—they take action for you. If you connect Azure Monitor alerts with auto-scaling rules, you can automatically: 

  • Scale up resources when performance deteriorates 
  • Scale down when resources are underutilised 
  • Deploy additional capacity during traffic spikes 
  • Shut down non-critical systems during detected security incidents 
  • Adjust resources based on cost constraints 

This automated response capability transforms monitoring from a passive activity into an active management system. 

Speaking of automation… what else can the bots do for us? Let’s find out.  

Automation makes alerts even more useful 

The real power of Azure Monitor isn’t just in detecting issues—it’s in what happens next. With the right setup, your alerts can kickstart automated responses that fix problems before they escalate. 

Creating effective action groups 

Action groups determine what happens when an alert fires. 

You can set up different groups for different scenarios like security incidents, performance issues, or cost control measures. Each group can trigger multiple actions, from sending notifications to initiating remediation workflows. 

Automated responses to alerts 

Why manually intervene when your alerts can trigger automated fixes? Azure Monitor can initiate automation that handles routine issues without human involvement: 

  • Restarting troubled services before users notice problems 
  • Scaling resources up during traffic spikes or down during quiet periods 
  • Moving infrequently accessed data to cheaper storage tiers 
  • Implementing temporary security measures when suspicious activity is detected 

The more you can automate, the faster your recovery time and the lower your operational overhead. Nicely-designed automation means your system can self-heal for common issues, freeing up your team to focus on more complex problems that genuinely require human intelligence. 

Advanced orchestration 

For scenarios with more moving parts, integrate your alerts with Logic Apps or Azure Functions. These can check multiple conditions before acting, gather additional diagnostic information, or follow approval processes for sensitive changes. 

Not everything should be automated, though. For decisions requiring human judgment, alerts can trigger approval requests or incident tickets with the necessary context for quick decision-making. The goal isn’t to replace human expertise but to handle routine issues automatically while escalating only what truly needs attention. 

Real-world examples: What Azure Monitor could do for you 

To help spark some ideas, here are some potential scenarios that illustrate the power of Azure Monitor.  

Preventing security breaches before they happen 

Imagine a financial services company using Azure Monitor to track login attempts and user behaviour patterns. The system could automatically detect when a user logs in from an unusual location and tries to access sensitive data. Instead of waiting for a breach, Azure Monitor could: 

  • Immediately restrict the user’s permissions 
  • Notify the security team with all relevant context 
  • Trigger additional authentication requirements 
  • Document the whole incident for compliance purposes 

This sort of defensive action could prevent data loss and save the company from regulatory penalties and reputational damage.  

Improving application performance under load 

Let’s say you’ve got an e-commerce site and you’re worried about it slowing down during big sales events. 

Azure Monitor with Application Insights can save the day. It can pinpoint exactly which parts of your site are causing bottlenecks, and then automatically scale up those parts before anyone even notices a slowdown. It can even prioritise the most important parts of the buying process to keep things running smoothly. 

And your operations team gets real-time dashboards so they can keep an eye on everything. The end result? Happy customers who can shop without a hitch, even when the site’s getting slammed with traffic. 

Preventing off-hours resource waste 

Consider a software agency running expensive testing environments 24/7, despite only needing them during business hours. They could set up alerts that trigger automatic shutdowns at 7 PM and restarts at 7 AM on weekdays. 

With complete weekend shutdowns, they could see up to 65% reduction in compute costs without any impact on productivity. 

Managing unpredictable workload costs 

Now imagine an AI research team whose compute costs vary wildly based on experiment runs.  

A multi-tiered alert system could monitor both performance and costs, automatically scaling resources during legitimate processing needs, but notifying management when costs exceed certain thresholds. This balanced approach would optimise spending while making sure researchers have the compute power they need when they need it. 

How to not get sick of your alerts 

Alert fatigue is real. If your phone is constantly pinging with notifications, you’ll soon start ignoring them all—including the important ones. 

If you follow these best practices, you’ll build an alert system that highlights genuine issues without overwhelming your team with unnecessary notifications. The goal is to make your alerts helpful rather than annoying distractions. 

Better, fewer alerts 

The key to preventing alert fatigue is quality over quantity. Start with a small number of high-value alerts and expand gradually as you validate their usefulness. Use different notification channels for different severity levels—perhaps email for routine issues and text messages for critical ones. 

It’s also worth implementing “snooze” periods for known activities like planned deployments. This prevents a flood of expected alerts that everyone will just ignore anyway. Regularly review and adjust thresholds to reduce false positives. 

Documentation and knowledge sharing 

Take the time to explain what each alert means and what actions should be taken in response. This becomes especially valuable when new team members join who might not understand the context, or when you need cross-functional teams to collaborate on incident management. 

Good documentation creates consistency in how you respond to recurring issues. Rather than having everyone develop their own approach, a documented process prompts the best response every time. 

Review and refinement cycles 

Schedule monthly reviews to assess which alerts are providing value and which ones are just generating noise. Look for emerging patterns that might warrant new monitoring rules. 

These regular check-ins prevent your alert system from becoming stale or irrelevant. What worked perfectly six months ago might need adjusting as your usage patterns change. 

Alert governance frameworks 

For larger organisations, think about implementing a more formal governance structure around your alerts. This doesn’t need to be bureaucratic—just clear about who owns different alert categories, what your KPIs are, and what the escalation paths are when issues arise. 

Getting started with Azure Monitor – your next steps 

Azure Monitor does a lot if you ask it to—but start at the beginning. Keep it simple. 

One great resource to consider is Microsoft Learn’s guide: Deploy and configure Azure Monitor. It’ll take you through app monitoring, Log Analytics, setting up alerts, and more. If you can spare four hours or so, it’s worth going through to boost your confidence. 

From there, you’re probably best focusing on your biggest pain points—availability, performance, security, or costs—and building from there. Remember that even small improvements in visibility can lead to major benefits over time. 

And if you’d rather have experts handle the setup for you, that’s where Synextra comes in. As a boutique cloud MSP, we specialise in helping UK businesses get more value from their Azure investments without the impersonal approach of the corporate giants. 

Our team can help you: 

  • Build the right alerts and dashboards for your environment 
  • Set up automated responses to common issues 
  • Provide ongoing support and optimisation 
  • Train your team to get the most from your monitoring 

Get in touch today to speak to one of our friendly cloud experts.  


Article By:
Synextra
thank you for contacting us image
Thanks, we'll be in touch.
Go back
By sending this message you agree to our terms and conditions.